1 Introduction
Why do we forecast at all? Forecasts are necessary for any decision under uncertainty. Good forecasts can be very valuable. Bad forecasts can threaten your company’s very survival. This chapter discusses the value of a good forecasting process and briefly examines forecasting software.
1.1 The value of a good forecasting process
It is common to become frustrated about forecasting. The necessary data is often dispersed throughout the organization. The algorithms used to analyze this data are often opaque. Those within the organization trained to understand the algorithms often do not understand the business, and those who breathe the business do not understand the algorithms. The actual forecast is then discussed in long and unproductive consensus meetings between diverse stakeholders with often conflicting incentives; in between, the forecast is often confused with goals, targets, and plans. The resulting consensus can be a political compromise far removed from any optimal use of information. Decision-makers often ignore these forecasts and instead come up with their own guess since they do not trust the forecast and the process that created it. Even if the forecasting process works well, the inherent demand uncertainty often creates actuals far from the forecast. It is hard to maintain clarity in such a setting and not become frustrated by how challenging it is to rely on forecasts.
Yet, what alternative do we have? Eliminating the forecasting process within an organization will only create worse parallel shadow processes. Every plan, after all, needs a forecast, whether that forecast is an actual number based on facts or just the gut feeling of a planner. Some companies can change their business model to a make-to-order system, eliminating the need to forecast demand and manufacture their products to stock. However, this alternative model still requires ordering components and raw materials based on a forecast, planning capacity, and training the workforce according to an estimate of future demand. Even a make-to-order system relies on an implicit forecast, namely that demand will stay sufficiently stable for the system to keep working.
A central metric for every supply chain is how long it would take for all partners in the supply chain to move one unit – from the beginning to the end – into the market. This metric shows the total lead time in the supply chain. If customers are not willing to wait that long for a product, a supply chain cannot change to a complete make-to-order system. Someone in the supply chain will need to forecast and hold inventory. If that forecasting system fails, the supply chain will feel the resulting costs and disruptions.
Every manager involved in forecasting must accept that there are no good or bad forecasts. There are only good or bad ways of creating or using forecasts. Forecasts should contain all the relevant information available to the organization and its supply chain about the market. Information is everything that reduces uncertainty. If a forecast is far from the actual demand, but the process that generated the forecast used all available information, the organization had bad luck. Conversely, if a forecast is spot on, but the process that created it neglected important information, the organization was lucky but should consider improving its forecasting process. In this sense, bad forecasts can only result from bad forecasting processes. As with decision-making under uncertainty generally, one should not question the quality of the decision or forecast itself given the actual outcome; one should only examine the process that led to this decision or forecast. Betting money in roulette on the number 20 does not become a bad choice just because the ball rolls onto a different number – and neither does it become a better choice if the ball happens to land on the 20!
Different time series are more or less predictable. If a series has much unexplainable variation, there is a limit to how well we can forecast it. Figure 1.1 offers an example of two time series that are very different in their forecastability. While a good forecasting process will lead to better predictions for a time series by explaining some variation in the series, there are limits to the inherent predictability of such series. Repeated inaccurate forecasts may be a sign of a bad forecasting process but may also result from excessive noise in the underlying demand. Accordingly, a good forecasting process is not necessarily one that predicts a time series perfectly but one that improves the forecasts for a series compared to simple forecasting methods (which can be pretty competitive indeed, see Chapter 8). We will discuss the concept of forecastability in more detail in Chapter 5 and examine how to deal with failure in the forecasting process in Chapter 21.
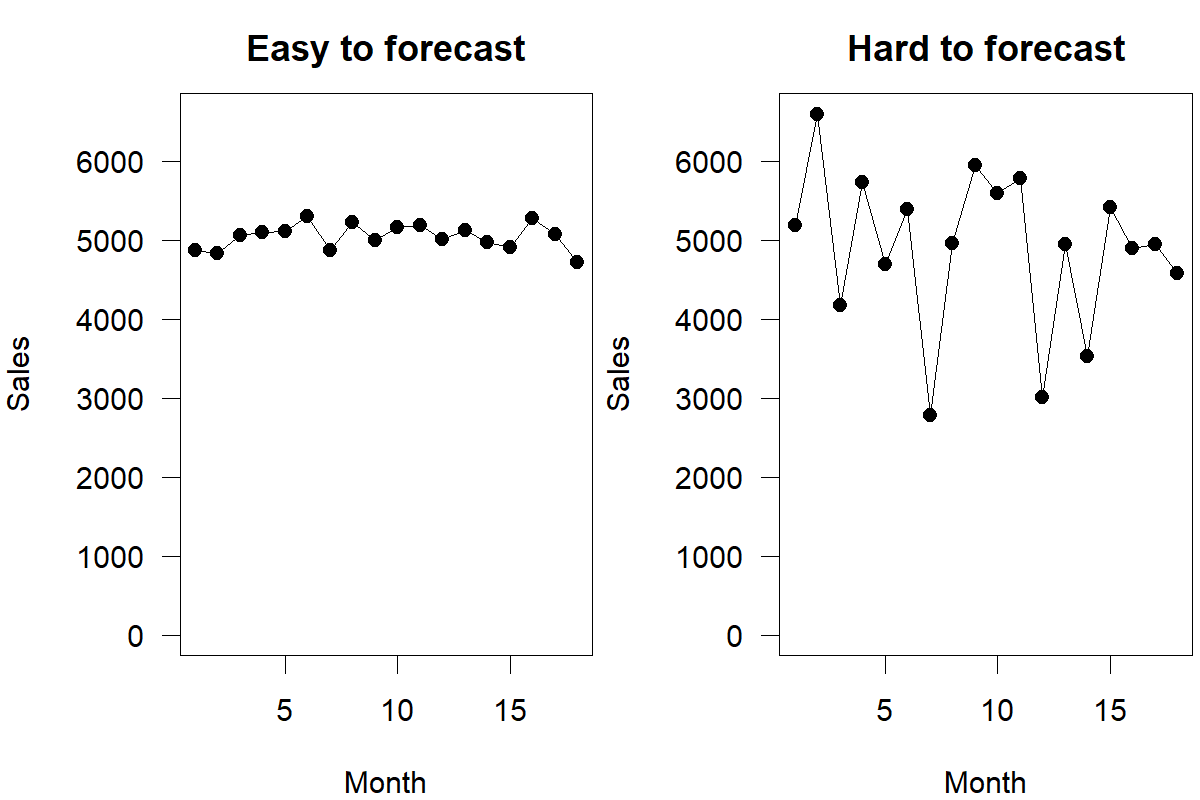
Figure 1.1: Easy and hard to forecast time series
Many organizations rely exclusively on point forecasts. A point forecast is a single number – an estimate of what an unknown quantity will most likely be. It is, however, improbable that the actual number will be exactly equal to the point forecast. Thus, one always needs to consider and deal with the remaining uncertainty in the forecast. Ideally, one should conceptualize a forecast as a probability distribution. That distribution can have a center, usually equal to the point forecast. Yet that distribution also has a spread, representing the remaining uncertainty around the point forecast. Good forecasting processes will communicate this spread effectively; bad forecasting processes will remain silent on this issue, projecting unrealistic confidence in a single number. Further, failing to communicate the inherent forecast uncertainty can lead to decision-makers using highly uncertain and highly certain forecasts similarly. It is common, for example, for firms to require equal safety stocks across different products, even though the uncertainty inherent in these products may vary vastly. The root cause of this problem often lies in insufficient reporting of uncertainty. We will further explore the idea of probabilistic forecasting in Chapters 3 and 4.
The effective design of forecasting processes seems complicated, but the benefits of getting the forecasting process right are tremendous. Fixing the forecasting process is a managerial challenge that usually does not require significant financial investments. The challenge of improving the forecasting process often does not lie in investing in advanced machines or information technology or in the costs of hiring more people and expanding the organization. Instead, the challenge is managing cross-functional communication and pushing through change despite many stakeholders (J. Smith, 2009).
Yet, the returns can be huge if an organization can overcome these challenges. For example, Oliva and Watson (2009) documented that the improvement of a forecasting process at an electronics manufacturing company led to a doubling of inventory turns and a decrease of 50% in on-hand inventory. Similarly, Clarke (2006) documents how the major overhaul of the forecasting process at Coca-Cola Inc. led to a 25% reduction in days of inventory. These are supply chain improvements that would otherwise require significant investments in technology; if an organizational change (though challenging and time-consuming) of the forecasting process can achieve similar objectives, every manager should take the opportunity to improve forecasting processes seriously.
1.2 Software
While we often highlight the managerial aspects of forecasting in this book, we also delve into the statistics of forecasting. Our goal in doing so is to provide managers with a basic intuition on how forecasting algorithms work – to shine some light into this black box. In this context, we emphasize that this book does not assume the use of any particular forecasting software. There is a large set to choose from when selecting a forecasting software, and a comprehensive review of the features, strengths, and weaknesses of all commercially available products is beyond the scope of this book. For an overview, interested readers may visit the OR/MS biannual survey of forecasting software; the most recent one was authored by Schaer et al. (2022).
Especially in the earlier chapters of this book, we will refer to functions in Microsoft Excel to help readers implement some ideas. This spreadsheet modeling software is widely available, and most managers will have a copy installed on their laptops or tablets. However, Excel suffers from inaccuracies in its statistical and optimization functions (Mélard, 2014). We would not wager that Microsoft has addressed these issues in the more recent version of Excel. Further, the standard functionality of Excel only allows for very limited time series analysis and forecasting. Therefore, using Excel for forecasting inevitably requires some coding and manual entry of formulas. Maintaining a consistent forecasting process in Excel is challenging. Spreadsheets start accumulating errors and undocumented changes over time (Singh, 2013). When implemented correctly, spreadsheets have the advantage of being very transparent. Commercially available forecasting software, on the contrary, can often have a black-box character. Excel is a good complementary tool for forecasting – learning, communicating, and testing out new ideas – but it should not become a standard, permanent tool for forecasting in an organization.
An important alternative is the free statistical computing environment R (https://www.r-project.org/, R Core Team, 2022). While R is more difficult to learn and use than Excel, its functionality is much broader. Through user-written content, many existing forecasting methods are free in R (Kolassa and Hyndman, 2010). Furthermore, Integrated Developing Environments (IDE) like RStudio (https://posit.co/) make the software more accessible, and excellent introductory books to R from a forecasting perspective are available (see Section 22.2). The forecast (Hyndman et al., 2023) and fable packages (O’Hara-Wild et al., 2020) are the gold standard of forecasting.
Similarly, many Data Scientists nowadays use Python, a ubiquitous programming language. One key advantage of Python over R is that software or IT professionals outside the forecasting world are much more likely to be familiar with it, making it easier to share code across functional boundaries. Python does have some time series forecasting functionalities. However, its forecasting strengths lie more in modern Machine Learning tools (see Chapter 14), and not so much in the classic time series tools. Nixtla (https://github.com/Nixtla) produced a lot of time series tools that are fast and perform well compared to various alternatives. Packages like statsforecast (Federico Garza, 2022), pmdarima (T. G. Smith et al., 2022), sktime (Löning et al., 2019) mainly aim at replicating (and therefore invariably lag behind) functionalities from R.
Key takeaways
Almost every business decision is about the future and is thus based on forecasts. We need forecasts. We cannot eliminate forecasts, but we can question whether we have an effective forecasting process that uses all available information within our organization and supply chain.
Different time series will differ in how hard they are to predict. Inaccurate forecasts may result from an ineffective forecasting process or may be due to the unpredictable nature of a particular business.
No forecast is perfect. We need to directly confront, quantify, and manage the uncertainty surrounding our forecasts. Failure to communicate this uncertainty makes risk management associated with the forecast ineffective.
Fixing the forecasting process can lead to considerable improvements in the organization and supply chain without significant technological investments. The challenge is to manage cross-functional communications and overcome organizational silos and conflicting incentives.