2 The forecasting workflow
Producing forecasts to inform decisions is an iterative process involving several potentially repeated steps. As shown in Figure 2.1, the forecasting workflow starts by identifying the decision that the forecast supports. Once we understand what decision the forecast informs, we need to derive the requirements we need to meet. We next gather data and information, prepare and visualize data, choose and train models, and produce the forecast. We can evaluate its performance and iterate to improve. Or we stop the iteration, communicate the forecast to stakeholders and possibly adjust the forecast by incorporating human judgment. This chapter outlines these steps in detail.
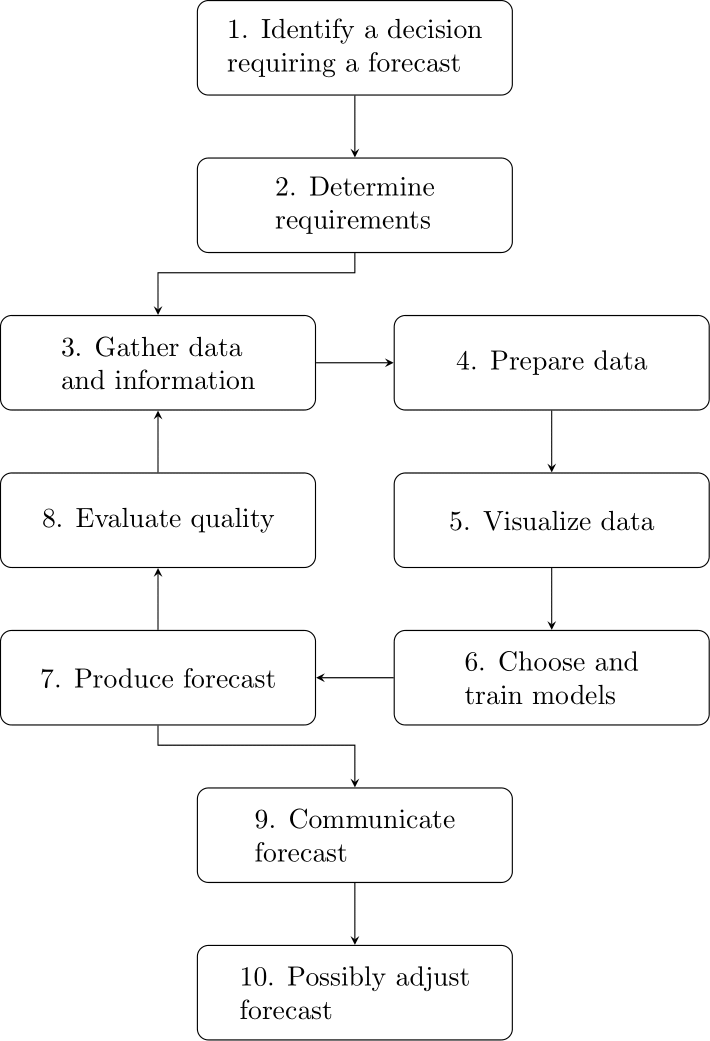
Figure 2.1: The forecasting workflow
2.1 Identify a decision requiring a forecast
Why prepare a forecast? If asked this question, most managers usually say, “to inform our decisions.” A forecast has no purpose per se. At least one, if not many, decisions within the organization require the forecast. This purpose determines the forecasting requirements. Any forecasting task should therefore start with identifying operational (short-term), tactical (mid-term), and strategic (long-term) decisions which require forecasts.
Examples of strategic decision and planning processes include network design, capacity planning, distribution channels, and workforce planning. At the tactical level, example decisions include product/service assortments, staffing, inventory optimization, and sales & operations planning (S&OP). At the operational level, firms make decisions related to production and workforce scheduling, distribution, transportation, and delivery plans. Forecasters must understand how the forecast is used, who requires it, and how it fits in with the organization. This initial step is essential and only sometimes straightforward.
2.2 Determine requirements
Each decision identified in the first step may require forecasting different data at different granularities, horizons, frequencies, and structures. Decisions will directly dictate the forecasting requirements, which should at least include the following:
- The forecast variable is what we intend to forecast and is also known as the response, output, or dependent variable. This variable should not be confused with the decision that the forecast intends to inform.
- The forecast horizon is how far into the future we forecast.
- The forecast frequency defines how often we generate the forecast.
- The temporal granularity is the time granularity we forecast (e.g., daily, weekly, and monthly totals).
- The cross-sectional granularity at which we forecast (e.g., Stock Keeping Unit or product group, store or region; see Chapter 13, especially Section 13.1).
| Level | Decision | Forecast horizon | Temporal granularity | Cross-sectional granularity | Forecast type |
|---|---|---|---|---|---|
| Strategic | Make-or-buy | Years | Yearly | Total | Expectation |
| Strategic | Enter new market | Years | Yearly | Total | Expectation |
| Tactical | Assortment plan | Months/years | Monthly | Category | Expectation |
| Tactical | Promotion plan | Weeks/months | Weekly | Brand | Expectation |
| Operational | Replenishment | Days/weeks | Daily | SKU | Quantile |
| Operational | Staffing | Days/weeks | Hourly/daily | Per worker type | Expectation |
Table 2.1 gives examples of the attributes of our forecasts driven by the decision.
In addition to determining the forecast requirements, we should consider some additional elements at this stage. For instance: how much can the forecast cost? How should we measure and report forecast accuracy? Does the forecast improvement add value to the business? Is the forecasting method easy to understand and interpretable? Should we use specific forecasting support systems and software? We cover these topics in different sections of this book.
2.3 Gather data and information
Once we have determined the forecasting requirements, we need to gather the relevant data and information that we will use to develop our forecasting model. Various types of data can be helpful at this stage:
Past/historical time series data on the variable we intend to forecast. If we want to forecast the sales volume of a product in the future, we need to collect past sales volume. Many organizations record historical data at finer time granularity or arbitrary timestamps. Forecasting usually requires some temporal aggregation. We discuss this in detail in Chapter 13.3.
Past and future data about deterministic predictors. Predictors are data that help us forecast a time series (see Chapter 11). A predictor is deterministic if its future values are known or determined in advance. Examples include different types of promotions or prices, public holidays, festivals, or sports events. Deterministic predictors can also be master data, which do not change over time, such as colors or sizes of products.
Past and future data about stochastic predictors. A predictor is stochastic if we cannot know its future values precisely. For instance, while we know the past weather, future weather is unknown. Therefore, we must forecast the future values of stochastic predictors if we include them in a forecasting model. Suppose our forecast depends on lagged values of a stochastic predictor (see Section 11.3). For example, tomorrow’s headache medication sales depend on today’s sports game outcome. In that case, we do not need to forecast the predictor.
Expertise of individuals in an organization and any contextual information that may affect the forecast variable. Domain knowledge of those who collect data, analyze it, produce forecasts, or use them to inform decisions is a valuable source of information. Such knowledge will help you tell the story behind the data, incorporate it into models and check the validity of the information. It can also be the reason why we adjust the output of our statistical forecasting. Sometimes, we may be unable to obtain enough data to use our models. Without data, we rely on judgmental forecasting methods alone (see Chapter 16), which incorporate domain knowledge of people in the organization and up-to-date information about future events.
2.4 Prepare data
Once we have the necessary raw data, we need to ensure it is a reliable source of information and is in the correct format for analysis and forecasting. Forecasting models may have different data requirements; some require the series to be in time order with no gaps, and others require no missing values. Checking our data is essential to understanding its features and should always be done before we train our models on data. Often, raw data has many problems, such as formatting issues, errors, or missing values. Data preparation generally involves importing data into the software, tidying the data, and checking and fixing errors, missing values, duplicated observations, and temporal gaps.
Raw data can be messy in infinite ways, and technical data science skills are often insufficient to prepare data for analysis. Using the knowledge of those who collect or work with data is crucial in preparing data. See Section 19.1 on what skills this requires of the forecaster. Section 5.3 contains a relevant discussion about data quality.
2.5 Visualize data
Before developing our model for a given dataset, we should conduct an initial analysis by plotting our data using data visualization tools. Plotting data will allow us to identify essential features such as trends or seasonality. If the data has no systematic features, producing accurate forecasts is challenging. We can use time series graphs to check data quality and identify unusual observations, such as extreme values and outliers. If something unusual occurs in the data, try to figure out what happened. Is it a product launch? Is it a special event (e.g., Black Friday)? Or is it an error in the data? Visualizing data helps to highlight potential issues and then take appropriate actions to fix them before choosing and training models. We introduce various time series graphs in Chapter 6 to help us visualize data.
2.6 Choose and train models
Which forecasting model should we choose? The answer depends on several factors such as the type of decision the forecast intends to inform, forecasting requirements, data availability, the strength of the relationships between predictors and the forecast variable, how important explainability is to us, and so on. It is common to choose, train and compare the performance of multiple models. Each model may have different assumptions and account for different types of systematic information. Instead of picking just one, we might use multiple models and combine their forecasts (see Section 8.6).
Once we have chosen the model to use in forecasting, we need to train it on the historical data. Training is the estimation of parameters using historical data so that the model can forecast the output as close as possible to the actual value. We examine some forecasting models in Chapter 8 to Chapter 16.
2.7 Produce forecast
Once we have selected and trained our models, we can use them to produce forecasts for the required horizon. We can represent the forecast as a point forecast, a prediction interval, or a probability density (see Chapter 4). If the model uses only the historical time series to forecast, we must provide the number of future observations we want to forecast. If our model uses additional information, such as predictors, we need to provide a dataset of future values of those predictors to generate the forecast. We discuss such causal models in Chapter 11.
2.8 Evaluate quality
After training a model on the historical data and producing forecasts, it is critical to investigate its performance. In this step, we want to ensure our model has not failed in capturing the systematic information and did not overfit by following unpredictable random errors. We can evaluate the forecast accuracy of the model after observing actual data for the forecast period. We provide more detail on assessing a model’s accuracy in Chapter 17.
However, “quality” also has dimensions besides accuracy, like runtime, storage requirements, data requirements, or explainability. A method may provide superior forecasting accuracy but run very slowly or be completely opaque except to experts. Such properties would hinder its acceptance among business users.
2.9 Communicate forecast
Two factors are essential to increase acceptance and use of forecasting in practice: (a) what forecasts we communicate to stakeholders and (b) how we communicate them. Traditionally, we represent forecasts as point forecasts. Such a representation does not acknowledge uncertainty about the future or give the information required for a decision-maker to manage risk. Communicating forecasts as distributions or prediction intervals is often preferable (See Chapter 4).
For effective communication, forecasters need to know how to display forecasts. Visualization is critical when communicating forecast distributions so stakeholders can appreciate the information. Moreover, communicating the forecast variable and its impact on decisions is vital. For instance, providing the forecast distribution of patient admissions using a forecasting model is essential in an Accident and Emergency department. Still, such a distribution per se is insufficient for decision-making. Complementing this information with the cost, number of staff required, and waiting times resulting from the demand forecasts and potential actions is more valuable (see Section 17.5).
2.10 Possibly adjust forecast
A forecast adjustment indicates an expert’s judgment about the final forecast. Adjusting statistical demand forecasts using people’s expertise is very common. Forecast adjustments could be beneficial when we know that the forecasting model omits some important information or new information has become available. In those cases, we can make adjustments. We should avoid minor adjustments and focus only on the important ones – and document the reasons for any adjustments. Over time, we can improve our models by incorporating key drivers to deliver a better baseline forecast in the first place. We devote Chapter 16 to the role of judgment in forecasting.
Key takeaways
The forecasting workflow should always start with identifying decisions that require forecasts.
Forecasting requirements must be clearly defined. We need to ensure that forecasts are being generated at the right frequency, over appropriate horizons, at the right level of temporal (e.g., at hourly, daily, weekly, etc.) and cross-sectional aggregation (e.g., at product group or Stock Keeping Unit level).
When building a model, we start with the historical time series data, identify potential deterministic or stochastic predictors and their lags, and any qualitative information available across the organization.
Data preparation for time series analysis and forecasting can include checking and fixing errors, missing values, duplicated observations, and temporal gaps.
Communicating forecasts in a format that acknowledges uncertainty and accuracy implications on decisions (i.e., business value) is critical.