18 Forecasting competitions
So far, we have considered many different forecasting methods, from purely statistical to judgmental. And we have only scratched the surface in this book; there are many more established forecasting methods. In addition, if you want to implement a forecasting system, each software vendor will have variants on these basic methods and home-grown, possibly proprietary algorithms. How do we decide which of these forecasting methods is the best for our data?
To decide between many different forecasting methods, or indeed between different parameterizations of a single model, we can run a so-called forecasting competition, in which various methods compete to provide the best forecast. Such forecasting competitions are not entirely straightforward to run. We therefore devote an entire chapter to describing the generally accepted best way of running them.
18.1 Planning
Similar to a randomized controlled trial in medicine, a forecasting competition needs to be specified and planned (see Figure 2.1). Changing parameters in mid-competition can be problematic. Including additional data after the first data delivery will likely lead to a more significant data cleansing effort than simultaneous delivery. Switching accuracy measures may mean that models change dramatically, possibly invalidating earlier work.
Think about the decision your forecast is supporting. Do you want it for planning marketing and promotions? Or for short-range ordering and replenishment decisions? What you use a forecast for will influence what data you will need. Once you know the purpose of a forecast, the time granularity, location dimensions (see Chapter 13), the forecast horizon, and what accuracy measures to use (see Chapter 17) will become apparent. You may need forecasts for different purposes, requiring you to carefully consider aggregation and forecast hierarchies (again, see Chapter 13).
Plan for an iterated process during the competition. Perhaps the people that perform the forecasting are already familiar with your data. For example, they may belong to an established forecasting group within your business and have been forecasting your time series for years. In that case, they may already understand your data’s quirks and how forecasts are created and used. However, you may perform the forecasting competition on data from a new subsidiary, or involve external consultants or third-party forecasting software vendors. In that case, they must understand your data before calculating meaningful forecasts. It is best to introduce the data via live discussions, either face-to-face or via web conferencing. Written data descriptions are helpful, but forecasting experts will always have additional questions. You would not expect your doctor to provide a reliable diagnosis based on a written report of your symptoms either: context, nuance, and undocumented knowledge matter.
As discussed in Chapter 17, numerous forecast accuracy measures exist. Invest some time in choosing good ones to use for comparison. Specific measures may be unusable for your data, like, e.g., MAPE for data with zeros. Or they may lead to biased forecasts, like MAE for low-volume data. If you use multiple series on different scales, make sure your accuracy measures can meaningfully be compared and summarized across scales using percentage or scaled error measures. Think about using more than one error measure – each performance index is better than others at detecting different problems in your forecasts. However, if you do use different accuracy measures, be open to getting and processing different forecasts, one for each error measure, since different forecasts are optimal for different accuracy measures. You should assess forecasts on both bias and accuracy, as described in Chapter 17.
If your forecasting competition includes external parties, do not be afraid of involving them already in the early planning stage. After all, you are planning on trusting these people’s software and expertise with a mission-critical process in your business, so you should be able to trust that they know what they are doing. A dedicated forecasting software provider or consultant may know more about forecasting and have more expertise with more different datasets than your in-house forecasting group, although your in-house experts will likely know your specific data better. Tap this external expertise. Discuss your business and your data with the vendor. Consider their suggestions about what data to include in the forecasting competition. Of course, the vendor will look out for themselves first, but that does not mean their proposals will be useless. In addition, this kind of early discussion also allows you to gauge their expertise and commitment. Try to get subject matter experts to participate in these discussions, not just salespeople.
18.2 Data
After you have thought about what you need the forecast for, you can start collecting data. Make the dataset representative. If the forecast competition aims at identifying a method to forecast a small number of highly aggregated time series, perform the competition on a small number of highly aggregated time series. If you are looking for an automated method that can perform well on thousands of series, use an extensive dataset with thousands of series. If you only give out 20 series, the forecasters will tune each model by hand. Such fine-tuning will not be possible in a production environment with thousands of series – so use more data in the competition.
Does your day-to-day data contain outliers or invalid periods? Make sure to include such series. Conversely, do you plan on forecasting only pre-cleaned data? Then clean the data in the same way before you release it to the competition. Do you have causal drivers, like promotions or weather? Then include these effects in the dataset you provide. As in our example in Chapter 8, the causal effects may or may not improve the forecast, but you will not know if you do not try. Make the data you release for the competition representative of the actual forecasting task you need for your business.
However, as Chapter 11 notes, causal models can require forecasts of causal drivers. If your business depends heavily on the weather, your demand forecast will need to rely on weather forecasts. Suppose you run your forecasting competition using actual weather instead of forecasted weather. In that case, you are pretending that you know the future weather perfectly, and your forecasts will be better than if you relied on weather forecasts instead. Your causal models will appear to perform better than in a production environment. Thus, include forecasts of your causal drivers for the forecasting period. As a general rule, a forecast prepared in a particular period should only use the information available in that period.
18.3 Procedure
In principle, the procedure of a forecasting competition is simple: collect data, calculate forecasts, and evaluate the forecast. Since we have already discussed data selection and collection, we now focus on the remaining steps.
One key aspect in forecasting competitions is to hold back evaluation data (hold-out sample). For instance, you could collect demand data from three years, give out the first two years’ demands, keep the third year’s demands for evaluation, and require forecasts for this third year. If the forecaster knows the third year’s demands, they may succumb to the temptation to “snoop,” tweaking their forecasts until they perform best on the known evaluation sample. Of course, that will not work in an actual production environment. Avoid the opportunity to cheat, especially for external vendors.
This discussion leads us to a related aspect: why should we use separate evaluation data? Is assessing how well a forecasting method fits the historical data insufficient? If one method performs better in-sample than another method, should it not yield better forecasts, too? Unfortunately, this appealing logic does not work. As a rule of thumb, more complex models deliver better in-sample fits than simpler models (e.g., a seasonal vs. non-seasonal or trend vs. no-trend model). But beyond some optimal complexity, in-sample fit keeps improving while out-of-sample forecast accuracy starts deteriorating. The reason is that the more complex models start fitting to noise instead of capturing a signal.
Figure 18.1 illustrates this effect, using the “hard to forecast” series from Figure 1.1 and giving MSEs in thousands. We fit four models of increasing complexity to the first 12 months of data and forecast the last six months. As we see, the more complex the models are, as reflected in more flexible time influences, the closer the in-sample fit mirrors historical data and the lower the in-sample MSE. But out-of-sample forecasts get worse and worse. Thus, the in-sample fit is not a reliable guide to out-of-sample forecast accuracy, and we should never rely on in-sample accuracy to judge a forecasting method.
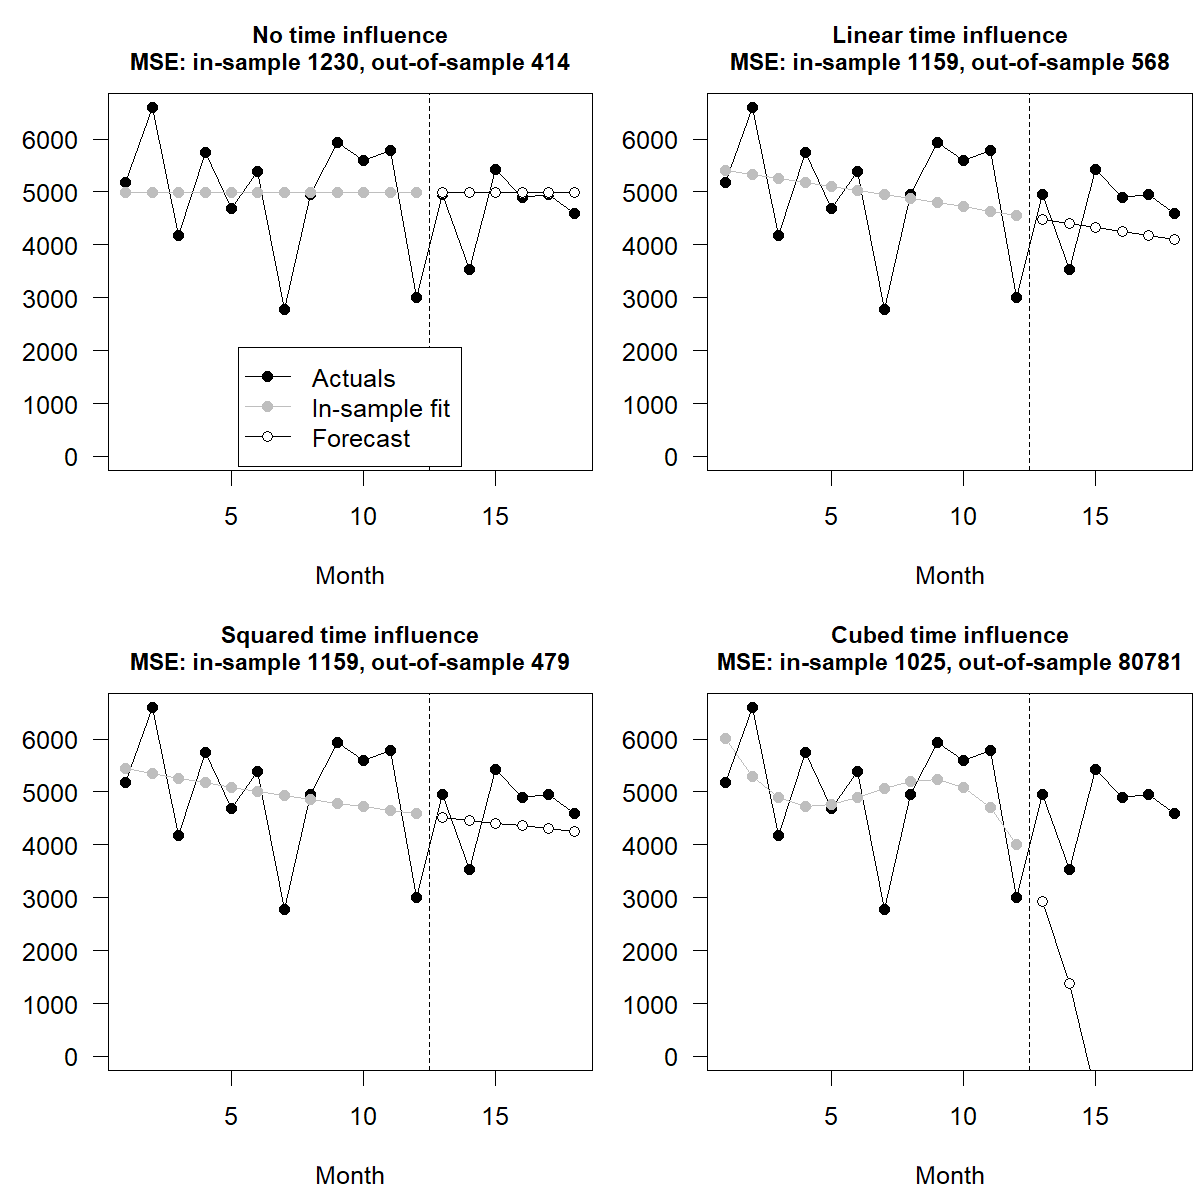
Figure 18.1: In-sample and out-of-sample performance for more complex models
Let us continue with the actual procedure of a forecasting competition. You can run either single origin or rolling origin forecasts. In a single-origin setting, as in Figure 18.1, you might give out 12 months of data and require forecasts for the next six months, allowing you to assess forecasts on horizons between one and six months ahead. In a rolling-origin forecast competition, you would give out 12 months of data and require six months of forecasts. You then provide the actual demand for one more month, requiring five more months of forecasts, etc. In such a rolling origin setup, the forecast method can learn from each additional month of historical data and adapt. This more closely mimics actual forecasting processes, which repeat and iterate, adapting to new information. Plus, this process gives you more forecasts to evaluate. On the other hand, in a rolling origin setup we need to organize multiple exchanges of forecast and actual data and keep careful track of a forecast’s “vintage”: Was a given forecast for June a one-step-ahead forecast based on data until May or a two-step-ahead forecast based on data through April? Overall, rolling origin forecast competitions are more realistic but require more effort, primarily if you communicate with one or multiple external vendors. If your internal forecasting group runs the competition, rolling origins may simply need a few more lines of code.
Figure 18.2 provides an example of rolling origin forecasting. We use 7 data points as the initial time series (i.e., in-sample) to forecast three subsequent periods that we use for assessment (i.e., out-of-sample). Each iteration adds a new data point at the end of the series and resets the forecasting origin. The procedure stops when the number of periods remaining at the end of the series equals the length of the forecast horizon. We then calculate forecast accuracy for each origin and average the accuracy across all origins.
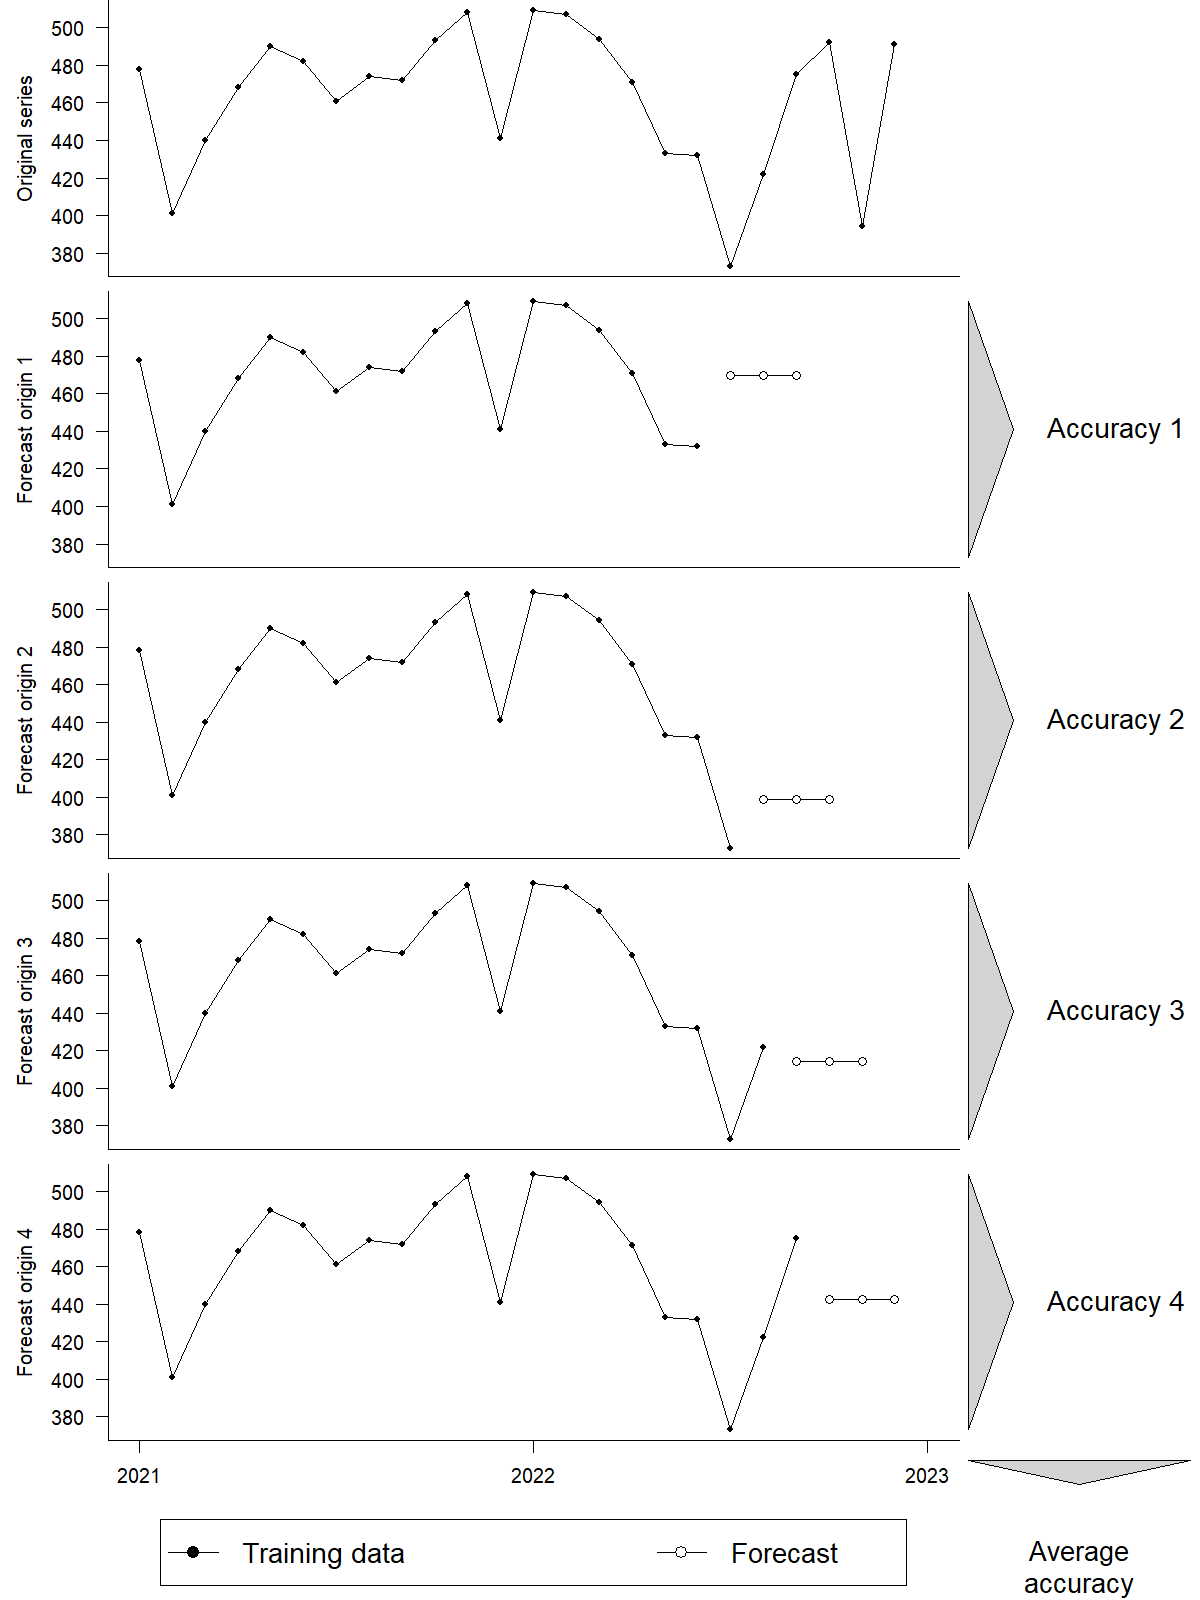
Figure 18.2: A rolling origin forecasting competition with an initial length of 18 periods, 4 forecasting origins and a forecast horizon of 3 periods
Finally, examine different angles when evaluating the forecasts of different methods. Summarize forecasts per series (if you have more than one forecast per series), then summarize these sums across all series, e.g., by taking averages of errors. Considering different forecasting horizons, look at how errors behave for one-step, two-step, and longer-range forecasts. Did you include series with outliers (in the historical or the future period) in your dataset? Or series strongly influenced by seasonality or causal factors? If so, check how your forecasts performed on those. Do not only look at averages of errors over series, but also at forecasts that performed terribly. Two methods may yield similar errors on average, but one of the two methods may break down badly in certain circumstances. Such rare spectacular failures can erode users’ trust in a forecasting system, even if forecasts are good on average. Assess a method’s robustness. Finally, consider discussing results with the forecasters, whether internal or external – you may learn interesting things this way.
18.4 Additional aspects
Of course, the main focus of our forecasting competition lies in forecasting and accuracy. However, as discussed above, forecasting does not happen in a vacuum. We want forecasts in the first place to support business decisions, like how many units of a product to assemble. It is likely not the forecast itself but the final business decision that influences the bottom line. Good forecasts do not earn or save money – good decisions do. And depending on subsequent decision-making processes, forecasts with very different accuracies may yield similar impacts on the bottom line. For instance, if the actual demand is 600 and the two methods generate forecasts of 700 and 900 units, the first method is more accurate. However, if your operations constrain you to assemble in batches of 1,000, both forecasts would likely lead you to the same business decision: building 1,000 units. Key performance indicators, like the service level and the overstock, would have been equivalent. For all practical purposes, spending additional funds to obtain and use the more accurate forecast would have been a waste. (However, if such situations occur frequently, you may want to make your production more flexible.) Thus, it makes sense to simulate the entire process, including forecasting and subsequent decision-making.
Finally, there are other aspects of a forecasting method beyond forecasting accuracy. A method may be highly accurate but require a lot of manual tuning by statistical experts, which can become expensive. Further, more complex forecasting methods can be more challenging to explain and “sell” to other stakeholders. The forecasts from these methods stand a higher chance of being ignored even if they are more accurate (P. F. Taylor and Thomas, 1982). Or the method may take too much time to run – one technology may give you all your forecasts within seconds, while the other may need to run overnight. Last but not least, when your forecasting methods must apply to large datasets, slight differences in computational time scale quickly. Using a faster method will not only allow you to save costs, but also to save energy usage, reducing the environmental impact of your forecasting operation – the CO2 emissions of large data centers are not trivial. Faster forecasting also allows more scenario planning, like changing causal variables and simulating the impact on demands. One forecasting software suite may be stand-alone and may require expensive integration into your ERP system. Another one may already be integrated with your ERP system or have well defined interfaces that connect well with your existing databases.
Key takeaways
- Plan out your forecasting competition ahead of time.
- Make sure your competition mirrors your actual forecasting situation regarding data and knowledge and the decisions the forecast must support.
- Do not be afraid of involving external experts in setting up a forecasting competition. Of course, make sure not to be taken for a ride.
- Always hold back the evaluation data.
- Evaluate forecasts by slicing the data in different ways to understand a forecasting method’s strengths and weaknesses.
- Forecast accuracy is not everything. Look at the larger picture, from decisions based on the forecast to ease of integration.